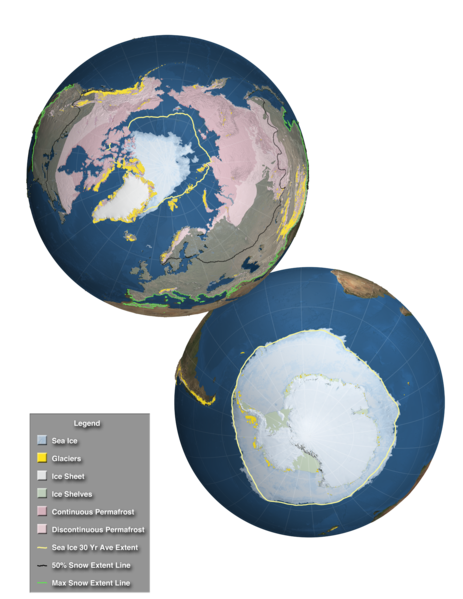
Tập tin:Components of the Cryosphere.tif

Kích thước bản xem trước PNG này của tập tin TIF: 463×599 điểm ảnh. Độ phân giải khác: 185×240 điểm ảnh | 371×480 điểm ảnh | 593×768 điểm ảnh | 791×1.024 điểm ảnh | 2.048×2.650 điểm ảnh.
Tập tin gốc (2.048×2.650 điểm ảnh, kích thước tập tin: 20,91 MB, kiểu MIME: image/tiff)
Lịch sử tập tin
Nhấn vào ngày/giờ để xem nội dung tập tin tại thời điểm đó.
| Ngày/giờ | Hình xem trước | Kích cỡ | Thành viên | Miêu tả | |
|---|---|---|---|---|---|
| hiện tại | 14:22, ngày 3 tháng 12 năm 2013 |  | 2.048×2.650 (20,91 MB) | Originalwana | {{Information |Description ={{en|1=This high resolution image, designed for the Fifth Assessment Report of the Intergovernmental Panel on Climate Change, shows the extent of the regions affected by components of the cryosphere around the world. Over... |
Trang sử dụng tập tin
Có 1 trang tại Wikipedia tiếng Việt có liên kết đến tập tin (không hiển thị trang ở các dự án khác):
Sử dụng tập tin toàn cục
Những wiki sau đang sử dụng tập tin này:
- Trang sử dụng tại azb.wikipedia.org
- Trang sử dụng tại de.wikipedia.org
- Trang sử dụng tại es.wikipedia.org
- Trang sử dụng tại eu.wikipedia.org
- Trang sử dụng tại fr.wiktionary.org
- Trang sử dụng tại he.wikipedia.org
- Trang sử dụng tại hi.wikipedia.org
- Trang sử dụng tại hu.wikipedia.org
- Trang sử dụng tại ja.wikipedia.org
- Trang sử dụng tại ky.wikipedia.org
- Trang sử dụng tại la.wikipedia.org
- Trang sử dụng tại sr.wikipedia.org
- Trang sử dụng tại sv.wikipedia.org
- Trang sử dụng tại th.wikipedia.org
- Trang sử dụng tại www.wikidata.org
- Trang sử dụng tại zh-yue.wikipedia.org

